
Murphy USA Inc. (MUSA): Price and Financial Metrics
MUSA Price/Volume Stats
| Current price | $397.96 | 52-week high | $404.93 |
| Prev. close | $392.66 | 52-week low | $231.65 |
| Day low | $392.00 | Volume | 157,800 |
| Day high | $399.56 | Avg. volume | 212,176 |
| 50-day MA | $367.50 | Dividend yield | 0.41% |
| 200-day MA | $334.23 | Market Cap | 8.47B |
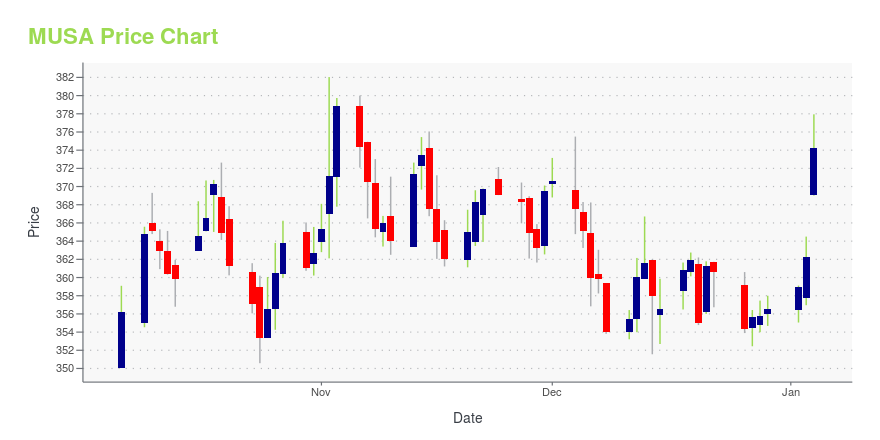
MUSA Stock Price Chart Interactive Chart >
MUSA POWR Grades
- MUSA scores best on the Value dimension, with a Value rank ahead of 82.13% of US stocks.
- The strongest trend for MUSA is in Value, which has been heading down over the past 26 weeks.
- MUSA ranks lowest in Momentum; there it ranks in the 1st percentile.

MUSA Stock Summary
- The capital turnover (annual revenue relative to shareholder's equity) for MUSA is 25.86 -- better than 98.86% of US stocks.
- The ratio of debt to operating expenses for MURPHY USA INC is higher than it is for about 81.23% of US stocks.
- With a price/sales ratio of 0.35, MURPHY USA INC has a higher such ratio than merely 11.66% of stocks in our set.
- Stocks with similar financial metrics, market capitalization, and price volatility to MURPHY USA INC are ENSV, QUAD, GLP, NGL, and WHR.
- MUSA's SEC filings can be seen here. And to visit MURPHY USA INC's official web site, go to www.murphyusa.com.
MUSA Valuation Summary
- MUSA's price/sales ratio is 0.3; this is 85% lower than that of the median Consumer Cyclical stock.
- MUSA's EV/EBIT ratio has moved up 0.3 over the prior 126 months.

Below are key valuation metrics over time for MUSA.
| Stock | Date | P/S | P/B | P/E | EV/EBIT |
|---|---|---|---|---|---|
| MUSA | 2023-12-29 | 0.3 | 9.0 | 14.5 | 12.3 |
| MUSA | 2023-12-28 | 0.3 | 9.0 | 14.4 | 12.3 |
| MUSA | 2023-12-27 | 0.3 | 9.0 | 14.4 | 12.3 |
| MUSA | 2023-12-26 | 0.3 | 8.9 | 14.4 | 12.3 |
| MUSA | 2023-12-22 | 0.4 | 9.1 | 14.6 | 12.4 |
| MUSA | 2023-12-21 | 0.4 | 9.1 | 14.7 | 12.5 |
MUSA Growth Metrics
- Its 2 year net cashflow from operations growth rate is now at 123.49%.
- Its 3 year revenue growth rate is now at 33.06%.
- Its 3 year cash and equivalents growth rate is now at 97.45%.

The table below shows MUSA's growth in key financial areas (numbers in millions of US dollars).
| Date | Revenue | Operating Cash Flow | Net Income to Common Stock |
|---|---|---|---|
| 2022-12-31 | 23,446.1 | 994.7 | 672.9 |
| 2022-09-30 | 22,846.8 | 921.9 | 664 |
| 2022-06-30 | 21,252.5 | 923.1 | 548.5 |
| 2022-03-31 | 18,941.8 | 846.8 | 494 |
| 2021-12-31 | 17,360.5 | 737.4 | 396.9 |
| 2021-09-30 | 15,454.4 | 682.9 | 349.1 |
MUSA's Quality Factors
The “Quality” component of the POWR Ratings focuses on 31 different factors of a companies fundamentals and operational strength. Here are some key insights as we drill into the specifics of these quality attributes.- MUSA has a Quality Grade of C, ranking ahead of 64.59% of graded US stocks.
- MUSA's asset turnover comes in at 4.192 -- ranking 4th of 165 Retail stocks.
- PSMT, JWN, and ROST are the stocks whose asset turnover ratios are most correlated with MUSA.

The table below shows MUSA's key quality metrics over time.
| Period | Asset Turnover | Gross Margin | ROIC |
|---|---|---|---|
| 2021-09-30 | 4.192 | 0.060 | 0.123 |
| 2021-06-30 | 4.075 | 0.063 | 0.123 |
| 2021-03-31 | 3.773 | 0.076 | 0.154 |
| 2020-12-31 | 4.127 | 0.079 | 0.189 |
| 2020-09-30 | 4.346 | 0.073 | 0.184 |
| 2020-06-30 | 4.720 | 0.068 | 0.188 |
Murphy USA Inc. (MUSA) Company Bio
Murphy USA Inc. operates a chain of retail stations offering motor fuel products and convenience merchandise. The company was founded in 2013 and is based in El Dorado, Arkansas.
Latest MUSA News From Around the Web
Below are the latest news stories about MURPHY USA INC that investors may wish to consider to help them evaluate MUSA as an investment opportunity.
Here's Why Hold Strategy is Apt for ConocoPhillips (COP) NowFavorable oil price is aiding ConocoPhillips' (COP) bottom line. However, increasing production and operating expenses are hurting it. |
3 Energy Stocks With Solid Earnings Estimate Revisions for '24A favorable business environment in the energy space has heightened the need to bet on The Williams Companies (WMB), Western Midstream (WES) and Murphy USA (MUSA). |
Williams (WMB) to Buy Gas Storage Portfolio for $1.95 BillionWilliams (WMB) is set to acquire a $1.95B natural gas assets portfolio in the Gulf Coast, establishing a strong hold over the rapidly evolving energy landscape. |
Petrobras (PBR) Faces Roadblock in Carmopolis Assets SalePetrobras (PBR) faces hurdles as Carmo Energy, backed by Grupo Cobra, fails to make payment for oil assets on a $296 million installment, affecting the $1.1 billion assets sale. |
Shell (SHEL) Secures Natural Gas Production License in VenezuelaShell (SHEL) and Trinidad and Tobago's National Gas Company secure a 30-year license for the Dragon project, boosting economic prospects and LNG production. |
MUSA Price Returns
| 1-mo | 8.63% |
| 3-mo | 8.06% |
| 6-mo | 28.01% |
| 1-year | 45.77% |
| 3-year | 224.57% |
| 5-year | 410.18% |
| YTD | 11.61% |
| 2023 | 28.20% |
| 2022 | 41.02% |
| 2021 | 53.33% |
| 2020 | 12.06% |
| 2019 | 52.66% |
MUSA Dividends
| Ex-Dividend Date | Type | Payout Amount | Change | ||||||
|---|---|---|---|---|---|---|---|---|---|
| Loading, please wait... | |||||||||
Continue Researching MUSA
Want to see what other sources are saying about Murphy USA Inc's financials and stock price? Try the links below:Murphy USA Inc (MUSA) Stock Price | Nasdaq
Murphy USA Inc (MUSA) Stock Quote, History and News - Yahoo Finance
Murphy USA Inc (MUSA) Stock Price and Basic Information | MarketWatch
Loading social stream, please wait...