
SandRidge Energy, Inc. (SD): Price and Financial Metrics
SD Price/Volume Stats
| Current price | $12.80 | 52-week high | $17.80 |
| Prev. close | $12.95 | 52-week low | $11.51 |
| Day low | $12.72 | Volume | 437,000 |
| Day high | $12.97 | Avg. volume | 587,067 |
| 50-day MA | $13.59 | Dividend yield | 3.12% |
| 200-day MA | $14.92 | Market Cap | 474.76M |
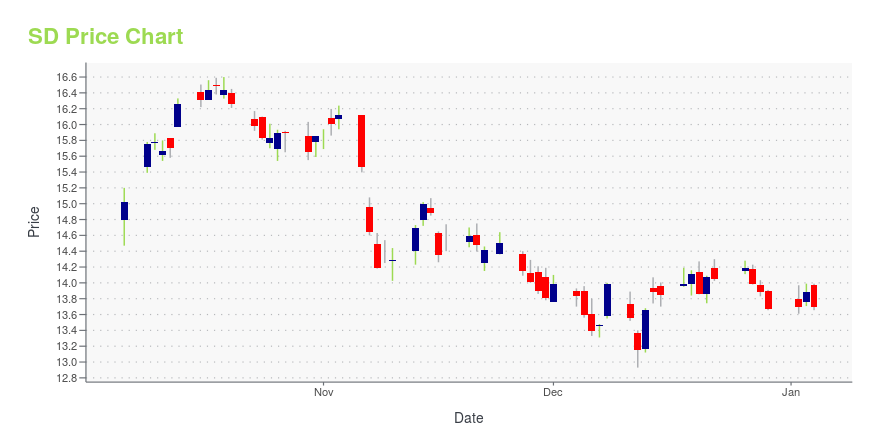
SD Stock Price Chart Interactive Chart >
SD POWR Grades
- Quality is the dimension where SD ranks best; there it ranks ahead of 94.31% of US stocks.
- The strongest trend for SD is in Quality, which has been heading down over the past 26 weeks.
- SD's current lowest rank is in the Growth metric (where it is better than 8.05% of US stocks).

SD Stock Summary
- With a price/earnings ratio of 3.14, SANDRIDGE ENERGY INC P/E ratio is greater than that of about only 2.28% of stocks in our set with positive earnings.
- The ratio of debt to operating expenses for SANDRIDGE ENERGY INC is higher than it is for about just 0.22% of US stocks.
- Revenue growth over the past 12 months for SANDRIDGE ENERGY INC comes in at -32.38%, a number that bests merely 8.34% of the US stocks we're tracking.
- Stocks with similar financial metrics, market capitalization, and price volatility to SANDRIDGE ENERGY INC are GRWG, HCC, DMLP, TEO, and MXC.
- SD's SEC filings can be seen here. And to visit SANDRIDGE ENERGY INC's official web site, go to www.sandridgeenergy.com.
SD Valuation Summary
- SD's price/earnings ratio is 3.1; this is 63.74% lower than that of the median Energy stock.
- SD's EV/EBIT ratio has moved NA NA over the prior 88 months.

Below are key valuation metrics over time for SD.
| Stock | Date | P/S | P/B | P/E | EV/EBIT |
|---|---|---|---|---|---|
| SD | 2023-12-28 | 3.0 | 1.1 | 3.1 | 3.1 |
| SD | 2023-12-27 | 3.0 | 1.1 | 3.2 | 3.2 |
| SD | 2023-12-26 | 3.1 | 1.1 | 3.2 | 3.3 |
| SD | 2023-12-22 | 3.1 | 1.1 | 3.2 | 3.2 |
| SD | 2023-12-21 | 3.1 | 1.1 | 3.2 | 3.2 |
| SD | 2023-12-20 | 3.0 | 1.1 | 3.1 | 3.1 |
SD's Quality Factors
The “Quality” component of the POWR Ratings focuses on 31 different factors of a companies fundamentals and operational strength. Here are some key insights as we drill into the specifics of these quality attributes.- SD has a Quality Grade of A, ranking ahead of 98.35% of graded US stocks.
- SD's asset turnover comes in at 0.456 -- ranking 57th of 137 Petroleum and Natural Gas stocks.
- APA, CPE, and EQT are the stocks whose asset turnover ratios are most correlated with SD.

The table below shows SD's key quality metrics over time.
| Period | Asset Turnover | Gross Margin | ROIC |
|---|---|---|---|
| 2021-06-30 | 0.456 | 0.638 | 0.020 |
| 2021-03-31 | 0.372 | 0.590 | -1.129 |
| 2020-12-31 | 0.316 | 0.538 | -0.938 |
| 2020-09-30 | 0.321 | 0.563 | -1.341 |
| 2020-06-30 | 0.292 | 0.538 | -1.195 |
| 2020-03-31 | 0.303 | 0.567 | -0.626 |
SD Price Target
For more insight on analysts targets of SD, see our SD price target page. And for a list of of all stocks sorted by upside potential based on analyst target price, see our Top Price Target page.
| Average Price Target | $6.62 | Average Broker Recommendation | 2 (Hold) |
SandRidge Energy, Inc. (SD) Company Bio
SandRidge Energy, Inc., an energy company, engages in the exploration, development, and production of crude oil, natural gas, and natural gas liquids primarily in the area of Mid-Continent in Oklahoma and Kansas. The company is based in Oklahoma City, Oklahoma.
Latest SD News From Around the Web
Below are the latest news stories about SANDRIDGE ENERGY INC that investors may wish to consider to help them evaluate SD as an investment opportunity.
Q3 2023 SandRidge Energy Inc Earnings CallQ3 2023 SandRidge Energy Inc Earnings Call |
SandRidge Energy Inc (SD) Reports Q3 2023 Earnings, Declares $0.10 Per Share Cash DividendCompany sees net income of $18.7 million, adjusted EBITDA of $22.6 million, and free cash flow of $24.2 million for Q3 |
SANDRIDGE ENERGY, INC. ANNOUNCES FINANCIAL AND OPERATING RESULTS FOR THE THREE AND NINE-MONTH PERIODS ENDED SEPTEMBER 30, 2023, DECLARES $0.10 PER SHARE CASH DIVIDEND, AND PROVIDES CONFERENCE CALL INFORMATIONSandRidge Energy, Inc. (the "Company" or "SandRidge") (NYSE: SD) today announced financial and operational results for the three and nine-month periods ended September 30, 2023. |
With 58% ownership of the shares, SandRidge Energy, Inc. (NYSE:SD) is heavily dominated by institutional ownersKey Insights Institutions' substantial holdings in SandRidge Energy implies that they have significant influence over... |
Those who invested in SandRidge Energy (NYSE:SD) three years ago are up 734%Investing can be hard but the potential fo an individual stock to pay off big time inspires us. But when you hold the... |
SD Price Returns
| 1-mo | -8.90% |
| 3-mo | -11.60% |
| 6-mo | -17.58% |
| 1-year | -10.69% |
| 3-year | 148.52% |
| 5-year | 56.07% |
| YTD | -6.36% |
| 2023 | -18.18% |
| 2022 | 62.81% |
| 2021 | 237.42% |
| 2020 | -26.89% |
| 2019 | -44.28% |
SD Dividends
| Ex-Dividend Date | Type | Payout Amount | Change | ||||||
|---|---|---|---|---|---|---|---|---|---|
| Loading, please wait... | |||||||||
Continue Researching SD
Want to do more research on Sandridge Energy Inc's stock and its price? Try the links below:Sandridge Energy Inc (SD) Stock Price | Nasdaq
Sandridge Energy Inc (SD) Stock Quote, History and News - Yahoo Finance
Sandridge Energy Inc (SD) Stock Price and Basic Information | MarketWatch
Loading social stream, please wait...