
U.S. Energy Corp. (USEG): Price and Financial Metrics
USEG Price/Volume Stats
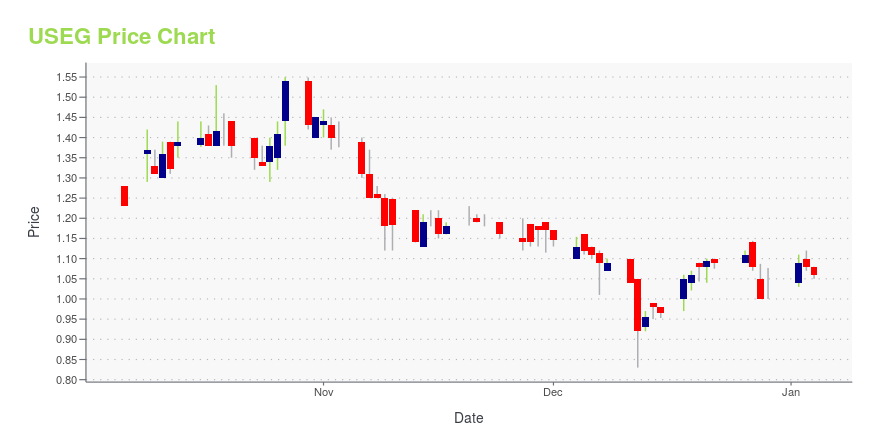
| Current price | $1.01 | 52-week high | $2.69 |
| Prev. close | $1.01 | 52-week low | $0.83 |
| Day low | $1.01 | Volume | 13,600 |
| Day high | $1.03 | Avg. volume | 35,706 |
| 50-day MA | $1.05 | Dividend yield | N/A |
| 200-day MA | $1.30 | Market Cap | 25.76M |
USEG Stock Price Chart Interactive Chart >
USEG Stock Summary
- USEG has a market capitalization of $27,547,096 -- more than approximately just 10.3% of US stocks.
- Over the past twelve months, USEG has reported earnings growth of 383.07%, putting it ahead of 96.9% of US stocks in our set.
- US ENERGY CORP's shareholder yield -- a measure of how much capital is returned to stockholders via dividends and buybacks -- is 11.4%, greater than the shareholder yield of 85.35% of stocks in our set.
- Stocks that are quantitatively similar to USEG, based on their financial statements, market capitalization, and price volatility, are EPSN, LBRT, ARCH, RNGR, and MXC.
- Visit USEG's SEC page to see the company's official filings. To visit the company's web site, go to www.usnrg.com.
USEG Valuation Summary
- In comparison to the median Energy stock, USEG's price/earnings ratio is 121.05% lower, now standing at -1.8.
- USEG's price/earnings ratio has moved up 4.9 over the prior 243 months.

Below are key valuation metrics over time for USEG.
| Stock | Date | P/S | P/B | P/E | EV/EBIT |
|---|---|---|---|---|---|
| USEG | 2023-12-28 | 0.7 | 0.4 | -1.8 | -2.8 |
| USEG | 2023-12-27 | 0.8 | 0.4 | -1.9 | -2.9 |
| USEG | 2023-12-26 | 0.8 | 0.4 | -2.0 | -3.0 |
| USEG | 2023-12-22 | 0.8 | 0.4 | -1.9 | -2.9 |
| USEG | 2023-12-21 | 0.8 | 0.4 | -1.9 | -2.9 |
| USEG | 2023-12-20 | 0.8 | 0.4 | -1.9 | -2.9 |
USEG Growth Metrics
- Its 3 year cash and equivalents growth rate is now at 63.69%.
- The 5 year price growth rate now stands at -38.54%.
- Its 5 year cash and equivalents growth rate is now at -47.5%.

The table below shows USEG's growth in key financial areas (numbers in millions of US dollars).
| Date | Revenue | Operating Cash Flow | Net Income to Common Stock |
|---|---|---|---|
| 2022-09-30 | 36.185 | 8.363 | -0.634 |
| 2022-06-30 | 26.143 | 4.1 | -4.663 |
| 2022-03-31 | 14.319 | 0.87 | -4.992 |
| 2021-12-31 | 6.658 | -0.153 | -1.77 |
| 2021-09-30 | 5.468 | -0.187 | -0.727 |
| 2021-06-30 | 4.085 | -0.838 | -2.628 |
USEG's Quality Factors
The “Quality” component of the POWR Ratings focuses on 31 different factors of a companies fundamentals and operational strength. Here are some key insights as we drill into the specifics of these quality attributes.- USEG has a Quality Grade of C, ranking ahead of 33.11% of graded US stocks.
- USEG's asset turnover comes in at 0.285 -- ranking 89th of 136 Petroleum and Natural Gas stocks.
- WTI, HFC, and TTI are the stocks whose asset turnover ratios are most correlated with USEG.

The table below shows USEG's key quality metrics over time.
| Period | Asset Turnover | Gross Margin | ROIC |
|---|---|---|---|
| 2021-06-30 | 0.285 | 0.477 | -0.330 |
| 2021-03-31 | 0.212 | 0.284 | -0.764 |
| 2020-12-31 | 0.206 | 0.269 | -0.735 |
| 2020-09-30 | 0.260 | 0.422 | -0.625 |
| 2020-06-30 | 0.334 | 0.543 | -0.430 |
| 2020-03-31 | 0.426 | 0.632 | -0.076 |
U.S. Energy Corp. (USEG) Company Bio
US Energy Corp. operates as an independent energy company. The Company focuses on the acquisition and development of oil and gas producing properties. US Energy serves customers in the United States.
Latest USEG News From Around the Web
Below are the latest news stories about US ENERGY CORP that investors may wish to consider to help them evaluate USEG as an investment opportunity.
U.S. Energy Corp. Reports Financial and Operating Results for Third Quarter 2023HOUSTON, Nov. 13, 2023 (GLOBE NEWSWIRE) -- U.S. Energy Corporation (NASDAQ: USEG, “U.S. Energy” or the “Company”), a growth-focused energy company engaged in operating a portfolio of high-quality producing oil and natural gas assets, today reported financial and operating results for the three months ended September 30, 2023. THIRD QUARTER 2023 HIGHLIGHTS Net daily production of 1,652 barrels of oil equivalent per day (“Boe/d”), a 6% decrease over third quarter of 2022Oil production of 100,071 b |
Insiders Give Up US$83k As U.S. Energy Stock Drops To US$1.44The recent price decline of 11% in U.S. Energy Corp.'s ( NASDAQ:USEG ) stock may have disappointed insiders who bought... |
U.S. Energy Corp. Reports Financial and Operating Results for Second Quarter 2023HOUSTON, Aug. 14, 2023 (GLOBE NEWSWIRE) -- U.S. Energy Corporation (NASDAQ: USEG, “U.S. Energy” or the “Company”), a growth-focused energy company engaged in operating a portfolio of high-quality producing oil and natural gas assets, today reported financial and operating results for the three months ended June 30, 2023. SECOND QUARTER 2023 HIGHLIGHTS Record net daily production of 1,959 barrels of oil equivalent per day (“Boe/d”), a 10% increase over second quarter of 2022Oil production of 114, |
U.S. Energy Corp. Announces Appointment of New Chief Financial OfficerHOUSTON, June 05, 2023 (GLOBE NEWSWIRE) -- U.S. Energy Corp. (NASDAQCM: USEG) (“U.S. Energy” or the “Company”) today announced that Mark Zajac has been appointed Chief Financial Officer (“CFO”), effective June 1, 2023. Mr. Zajac brings 30 years of leadership experience across energy and finance, primarily as a Partner and national industry leader with KPMG. "I look forward to welcoming Mark to the U.S. Energy team," said Ryan Smith, President and Chief Executive Officer of U.S. Energy. "Mark’s e |
Here's Why We're Wary Of Buying U.S. Energy's (NASDAQ:USEG) For Its Upcoming DividendRegular readers will know that we love our dividends at Simply Wall St, which is why it's exciting to see U.S. Energy... |
USEG Price Returns
| 1-mo | -1.94% |
| 3-mo | -15.13% |
| 6-mo | -26.81% |
| 1-year | -55.70% |
| 3-year | -79.83% |
| 5-year | -87.09% |
| YTD | 0.99% |
| 2023 | -55.33% |
| 2022 | -28.23% |
| 2021 | -11.14% |
| 2020 | 21.86% |
| 2019 | -54.93% |
Continue Researching USEG
Want to do more research on Us Energy Corp's stock and its price? Try the links below:Us Energy Corp (USEG) Stock Price | Nasdaq
Us Energy Corp (USEG) Stock Quote, History and News - Yahoo Finance
Us Energy Corp (USEG) Stock Price and Basic Information | MarketWatch
Loading social stream, please wait...