
Exxon Mobil Corp. (XOM): Price and Financial Metrics
XOM Price/Volume Stats
| Current price | $103.73 | 52-week high | $120.70 |
| Prev. close | $103.73 | 52-week low | $95.77 |
| Day low | $103.52 | Volume | 20,151,400 |
| Day high | $104.63 | Avg. volume | 19,300,412 |
| 50-day MA | $100.91 | Dividend yield | 3.66% |
| 200-day MA | $106.01 | Market Cap | 411.07B |
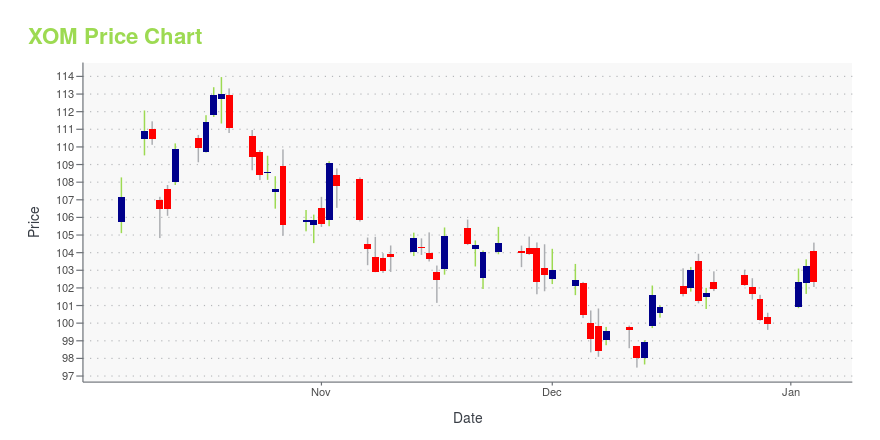
XOM Stock Price Chart Interactive Chart >
XOM POWR Grades
- XOM scores best on the Quality dimension, with a Quality rank ahead of 96.04% of US stocks.
- XOM's strongest trending metric is Stability; it's been moving down over the last 26 weeks.
- XOM ranks lowest in Sentiment; there it ranks in the 1st percentile.

XOM Stock Summary
- With a market capitalization of $409,052,384,193, EXXON MOBIL CORP has a greater market value than 99.65% of US stocks.
- XOM's went public 38.03 years ago, making it older than 92.92% of listed US stocks we're tracking.
- The volatility of EXXON MOBIL CORP's share price is greater than that of merely 5.26% US stocks with at least 200 days of trading history.
- Stocks that are quantitatively similar to XOM, based on their financial statements, market capitalization, and price volatility, are V, MA, CVX, WMT, and JPM.
- XOM's SEC filings can be seen here. And to visit EXXON MOBIL CORP's official web site, go to corporate.exxonmobil.com.
XOM Valuation Summary
- XOM's EV/EBIT ratio is 6.7; this is 19.28% lower than that of the median Energy stock.
- XOM's price/sales ratio has moved down 0.1 over the prior 243 months.

Below are key valuation metrics over time for XOM.
| Stock | Date | P/S | P/B | P/E | EV/EBIT |
|---|---|---|---|---|---|
| XOM | 2023-12-28 | 1.1 | 2 | 9.7 | 6.7 |
| XOM | 2023-12-27 | 1.1 | 2 | 9.8 | 6.8 |
| XOM | 2023-12-26 | 1.1 | 2 | 9.8 | 6.8 |
| XOM | 2023-12-22 | 1.1 | 2 | 9.8 | 6.8 |
| XOM | 2023-12-21 | 1.1 | 2 | 9.8 | 6.8 |
| XOM | 2023-12-20 | 1.1 | 2 | 9.8 | 6.8 |
XOM Growth Metrics
- The 4 year price growth rate now stands at -46.81%.
- Its 5 year revenue growth rate is now at 6.98%.
- Its 2 year revenue growth rate is now at 23.12%.

The table below shows XOM's growth in key financial areas (numbers in millions of US dollars).
| Date | Revenue | Operating Cash Flow | Net Income to Common Stock |
|---|---|---|---|
| 2022-12-31 | 413,680 | 76,797 | 55,740 |
| 2022-09-30 | 403,216 | 76,300 | 51,860 |
| 2022-06-30 | 364,932 | 63,966 | 38,950 |
| 2022-03-31 | 316,993 | 53,653 | 25,790 |
| 2021-12-31 | 285,640 | 48,129 | 23,040 |
| 2021-09-30 | 247,215 | 35,010 | -5,900 |
XOM's Quality Factors
The “Quality” component of the POWR Ratings focuses on 31 different factors of a companies fundamentals and operational strength. Here are some key insights as we drill into the specifics of these quality attributes.- XOM has a Quality Grade of C, ranking ahead of 71.18% of graded US stocks.
- XOM's asset turnover comes in at 0.738 -- ranking 26th of 137 Petroleum and Natural Gas stocks.
- CVI, CLR, and PSX are the stocks whose asset turnover ratios are most correlated with XOM.

The table below shows XOM's key quality metrics over time.
| Period | Asset Turnover | Gross Margin | ROIC |
|---|---|---|---|
| 2021-09-30 | 0.738 | 0.342 | -0.018 |
| 2021-06-30 | 0.645 | 0.334 | -0.046 |
| 2021-03-31 | 0.532 | 0.347 | -0.067 |
| 2020-12-31 | 0.516 | 0.338 | -0.077 |
| 2020-09-30 | 0.562 | 0.347 | 0.015 |
| 2020-06-30 | 0.614 | 0.350 | 0.030 |
XOM Price Target
For more insight on analysts targets of XOM, see our XOM price target page. And for a list of of all stocks sorted by upside potential based on analyst target price, see our Top Price Target page.
| Average Price Target | $66.20 | Average Broker Recommendation | 1.84 (Hold) |
Exxon Mobil Corp. (XOM) Company Bio
Exxon Mobil Corp. engages in the exploration and production of crude oil and natural gas. The company, as we know it today, was formed on November 30, 1999 with the merger of Exxon Corp. and Mobil Corp., creating one of the largest publicly traded international energy companies in the world. In addition to traditional energy operations, Exxon Mobil Chemical is a global chemical company specializing in converting crude oil into petrochemical feedstocks that are used in medical equipment, electronics, clothing, vitamin capsules, tires, and many other products. Exxon currently produces approximately 2.3 million barrels of oil equivalent energy per day.
Latest XOM News From Around the Web
Below are the latest news stories about EXXON MOBIL CORP that investors may wish to consider to help them evaluate XOM as an investment opportunity.
7 Undervalued Gems That Wall Street Missed Out On in 2023Under a frenzied environment, it’s normal to overpay for certain hot investments – but this framework also drives the case home for undervalued stocks Wall Street overlooked. |
Alternative Energy Explorers: 3 Stocks Investing in a Greener FutureThese alternative energy stocks to buy represent companies making big investments that will translate into accelerated growth. |
The 5 Durable Economic MoatsAn "economic moat" (also called a "durable competitive advantage"), is a structural advantage in your business that prevents competitors from easily stealing away your customers. |
3 Energy Stocks You’ll Regret Not Buying SoonDiscover 2024's top energy stocks: Exxon Mobil, Chevron, EQT. |
Exxon Mobil Corporation (XOM) is Attracting Investor Attention: Here is What You Should KnowRecently, Zacks.com users have been paying close attention to Exxon (XOM). This makes it worthwhile to examine what the stock has in store. |
XOM Price Returns
| 1-mo | 7.99% |
| 3-mo | 0.22% |
| 6-mo | -1.40% |
| 1-year | -3.45% |
| 3-year | 124.35% |
| 5-year | 70.28% |
| YTD | 4.71% |
| 2023 | -6.26% |
| 2022 | 87.41% |
| 2021 | 57.58% |
| 2020 | -36.21% |
| 2019 | 7.23% |
XOM Dividends
| Ex-Dividend Date | Type | Payout Amount | Change | ||||||
|---|---|---|---|---|---|---|---|---|---|
| Loading, please wait... | |||||||||
Continue Researching XOM
Here are a few links from around the web to help you further your research on Exxon Mobil Corp's stock as an investment opportunity:Exxon Mobil Corp (XOM) Stock Price | Nasdaq
Exxon Mobil Corp (XOM) Stock Quote, History and News - Yahoo Finance
Exxon Mobil Corp (XOM) Stock Price and Basic Information | MarketWatch
Loading social stream, please wait...