
Barnwell Industries, Inc. (BRN): Price and Financial Metrics
BRN Price/Volume Stats
| Current price | $2.17 | 52-week high | $3.10 |
| Prev. close | $2.19 | 52-week low | $1.89 |
| Day low | $2.15 | Volume | 4,900 |
| Day high | $2.17 | Avg. volume | 8,085 |
| 50-day MA | $2.40 | Dividend yield | 2.07% |
| 200-day MA | $2.54 | Market Cap | 21.76M |
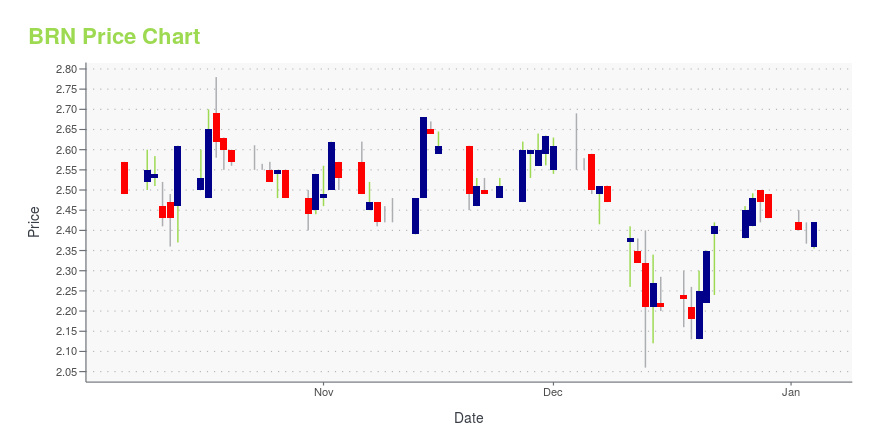
BRN Stock Price Chart Interactive Chart >
BRN Stock Summary
- BRN's went public 38.03 years ago, making it older than 92.92% of listed US stocks we're tracking.
- For BRN, its debt to operating expenses ratio is greater than that reported by just 4.05% of US equities we're observing.
- With a year-over-year growth in debt of -70.81%, BARNWELL INDUSTRIES INC's debt growth rate surpasses merely 2.63% of about US stocks.
- Stocks that are quantitatively similar to BRN, based on their financial statements, market capitalization, and price volatility, are UAMY, GIII, TDS, ZDGE, and HAIN.
- BRN's SEC filings can be seen here. And to visit BARNWELL INDUSTRIES INC's official web site, go to www.brninc.com.
BRN Valuation Summary
- BRN's price/sales ratio is 1; this is 37.5% lower than that of the median Energy stock.
- BRN's price/sales ratio has moved down 0.8 over the prior 243 months.

Below are key valuation metrics over time for BRN.
| Stock | Date | P/S | P/B | P/E | EV/EBIT |
|---|---|---|---|---|---|
| BRN | 2023-12-28 | 1.0 | 1.3 | -25.7 | -21.6 |
| BRN | 2023-12-27 | 1.0 | 1.3 | -25.8 | -21.7 |
| BRN | 2023-12-26 | 1.0 | 1.3 | -25.5 | -21.4 |
| BRN | 2023-12-22 | 1.0 | 1.3 | -25.1 | -21.0 |
| BRN | 2023-12-21 | 0.9 | 1.3 | -24.5 | -20.5 |
| BRN | 2023-12-20 | 0.9 | 1.2 | -23.4 | -19.5 |
BRN Growth Metrics
- Its 5 year cash and equivalents growth rate is now at -80.12%.
- The 4 year net income to common stockholders growth rate now stands at -1879.67%.
- Its 5 year price growth rate is now at -54.73%.

The table below shows BRN's growth in key financial areas (numbers in millions of US dollars).
| Date | Revenue | Operating Cash Flow | Net Income to Common Stock |
|---|---|---|---|
| 2022-12-31 | 30.602 | 7.279 | 5.529 |
| 2022-09-30 | 28.545 | 7.291 | 5.513 |
| 2022-06-30 | 24.775 | 4.395 | 7.203 |
| 2022-03-31 | 21.861 | 2.868 | 9.65 |
| 2021-12-31 | 19.18 | 1.66 | 6.742 |
| 2021-09-30 | 18.113 | 0.831 | 6.253 |
BRN's Quality Factors
The “Quality” component of the POWR Ratings focuses on 31 different factors of a companies fundamentals and operational strength. Here are some key insights as we drill into the specifics of these quality attributes.- BRN has a Quality Grade of A, ranking ahead of 96.62% of graded US stocks.
- BRN's asset turnover comes in at 1.155 -- ranking 12th of 136 Petroleum and Natural Gas stocks.
- NEX, ENSV, and HAL are the stocks whose asset turnover ratios are most correlated with BRN.

The table below shows BRN's key quality metrics over time.
| Period | Asset Turnover | Gross Margin | ROIC |
|---|---|---|---|
| 2021-06-30 | 1.155 | 0.357 | 1.292 |
| 2021-03-31 | 1.154 | 0.304 | -0.621 |
| 2020-12-31 | 1.118 | 0.336 | -0.603 |
| 2020-09-30 | 1.002 | 0.326 | -0.542 |
| 2020-06-30 | 0.865 | 0.302 | -0.987 |
| 2020-03-31 | 0.751 | 0.302 | -0.640 |
Barnwell Industries, Inc. (BRN) Company Bio
Barnwell Industries, Inc. acquires, develops, produces, and sells oil and natural gas in Canada. The company operates through three segments: Oil and Natural Gas, Land Investment, and Contract Drilling. It also invests in land interests in Hawaii. In addition, the company owns and operates five water well drilling rigs, two pump rigs, and other ancillary drilling and pump equipment; drills water and water monitoring wells of various depths; installs and repairs water pumping systems; and distributes Floway pumps and equipment in Hawaii. Barnwell Industries, Inc. was founded in 1956 and is headquartered in Honolulu, Hawaii.
Latest BRN News From Around the Web
Below are the latest news stories about BARNWELL INDUSTRIES INC that investors may wish to consider to help them evaluate BRN as an investment opportunity.
BRN Stock Earnings: Barnwell Industries Reported Results for Q4 2023Barnwell Industries just reported results for the fourth quarter of 2023. |
Barnwell Industries, Inc. Reports Fourth Quarter and Year End ResultsDivestiture of Hawaii Contract Drilling Operations to StreamlineOperations and Reduce Corporate Overhead Oil and Gas Drilling Program Planned HONOLULU, Dec. 15, 2023 (GLOBE NEWSWIRE) -- Barnwell Industries, Inc. (NYSE American: BRN) ("Barnwell" or the "Company") today announced its financial results for the fourth quarter and year ended September 30, 2023. The Company reported consolidated revenue of $6.8 million and a net loss of $96,000 which equates to a loss of $0.01 per share for the fourth |
Barnwell Industries, Inc. Announces Entry into Agreement for the Sale of Water Resources International, Inc. for Gross Proceeds of $2,000,000Transaction Unlocks Substantial Shareholder Value; Sale Expected to Streamline Operations to Focus on Domestic and Canadian Oil and Natural Gas BusinessHONOLULU, Dec. 14, 2023 (GLOBE NEWSWIRE) -- Barnwell Industries, Inc. (NYSE American: BRN) (“Barnwell” or the “Company”) today announced the entry into an agreement for the sale of Water Resources International, Inc. (“Water Resources”). Water Resources provides deep drilling and well pumping services needed in the exploration and development of |
Barnwell Industries, Inc. Reports Third Quarter and Nine Months Ended June 30, 2023 ResultsProduction of all Products Increased over the Prior Year’s Third Quarter Company Declares Cash Dividend HONOLULU, Aug. 11, 2023 (GLOBE NEWSWIRE) -- Barnwell Industries, Inc. (NYSE American: BRN) today reported net losses of $717,000, $0.07 per share, and $865,000, $0.09 per share, for the three and nine months ended June 30, 2023, respectively, as compared to net earnings of $2,531,000, $0.25 per share, and $5,656,000, $0.59 per share, for the three and nine months ended June 30, 2022, respectiv |
Barnwell Industries, Inc. Reports Results for its Second Quarter and Six Months Ended March 31, 2023 and the Declaration of a Cash DividendHONOLULU, May 15, 2023 (GLOBE NEWSWIRE) -- Barnwell Industries, Inc. (NYSE American: BRN) today reported net losses of $1,237,000, $0.12 per share, and $148,000, $0.01 per share, for the three and six months ended March 31, 2023, respectively, as compared to net earnings of $2,052,000, $0.21 per share, and $3,125,000, $0.33 per share, for the three and six months ended March 31, 2022, respectively. Mr. Alexander C. Kinzler, Chief Executive Officer of Barnwell, commented, “Our loss for the quarte |
BRN Price Returns
| 1-mo | -13.20% |
| 3-mo | -13.55% |
| 6-mo | -11.79% |
| 1-year | -13.08% |
| 3-year | -47.01% |
| 5-year | 69.02% |
| YTD | -10.70% |
| 2023 | -16.37% |
| 2022 | 2.66% |
| 2021 | 129.13% |
| 2020 | 23.31% |
| 2019 | -22.56% |
BRN Dividends
| Ex-Dividend Date | Type | Payout Amount | Change | ||||||
|---|---|---|---|---|---|---|---|---|---|
| Loading, please wait... | |||||||||
Continue Researching BRN
Want to do more research on Barnwell Industries Inc's stock and its price? Try the links below:Barnwell Industries Inc (BRN) Stock Price | Nasdaq
Barnwell Industries Inc (BRN) Stock Quote, History and News - Yahoo Finance
Barnwell Industries Inc (BRN) Stock Price and Basic Information | MarketWatch
Loading social stream, please wait...