
Spire Inc. (SR): Price and Financial Metrics
SR Price/Volume Stats
| Current price | $59.42 | 52-week high | $73.06 |
| Prev. close | $60.03 | 52-week low | $53.77 |
| Day low | $59.21 | Volume | 409,200 |
| Day high | $60.10 | Avg. volume | 682,018 |
| 50-day MA | $60.91 | Dividend yield | 5.08% |
| 200-day MA | $61.26 | Market Cap | 3.27B |
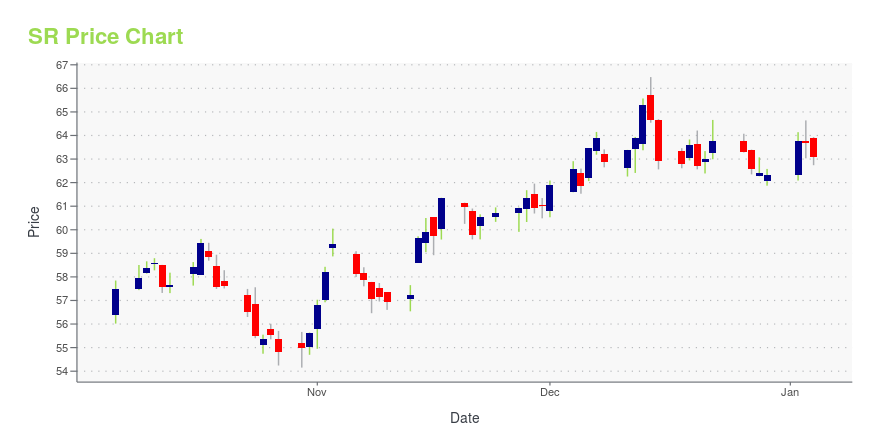
SR Stock Price Chart Interactive Chart >
SR POWR Grades
- SR scores best on the Value dimension, with a Value rank ahead of 57.31% of US stocks.
- The strongest trend for SR is in Quality, which has been heading down over the past 26 weeks.
- SR ranks lowest in Growth; there it ranks in the 6th percentile.

SR Stock Summary
- SR's went public 36.19 years ago, making it older than 90.86% of listed US stocks we're tracking.
- Of note is the ratio of SPIRE INC's sales and general administrative expense to its total operating expenses; only 0.17% of US stocks have a lower such ratio.
- For SR, its debt to operating expenses ratio is greater than that reported by 96.38% of US equities we're observing.
- Stocks with similar financial metrics, market capitalization, and price volatility to SPIRE INC are BKH, WTRG, LNT, ARTNA, and NWN.
- Visit SR's SEC page to see the company's official filings. To visit the company's web site, go to www.spireenergy.com.
SR Valuation Summary
- SR's price/sales ratio is 1.2; this is 33.33% lower than that of the median Utilities stock.
- Over the past 243 months, SR's EV/EBIT ratio has gone up 5.4.

Below are key valuation metrics over time for SR.
| Stock | Date | P/S | P/B | P/E | EV/EBIT |
|---|---|---|---|---|---|
| SR | 2023-12-27 | 1.2 | 1.1 | 16.4 | 18.1 |
| SR | 2023-12-26 | 1.3 | 1.2 | 16.6 | 18.2 |
| SR | 2023-12-22 | 1.3 | 1.2 | 16.8 | 18.2 |
| SR | 2023-12-21 | 1.3 | 1.1 | 16.5 | 18.1 |
| SR | 2023-12-20 | 1.3 | 1.1 | 16.5 | 18.1 |
| SR | 2023-12-19 | 1.3 | 1.2 | 16.7 | 18.2 |
SR Growth Metrics
- Its year over year price growth rate is now at -2.56%.
- Its 3 year price growth rate is now at -13.04%.
- The 5 year revenue growth rate now stands at 8.43%.
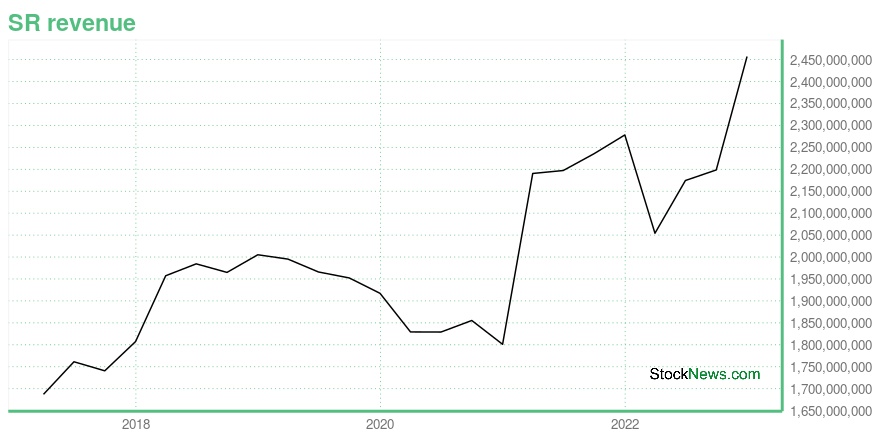
The table below shows SR's growth in key financial areas (numbers in millions of US dollars).
| Date | Revenue | Operating Cash Flow | Net Income to Common Stock |
|---|---|---|---|
| 2022-12-31 | 2,457.1 | 114.1 | 241 |
| 2022-09-30 | 2,198.5 | 55 | 205.7 |
| 2022-06-30 | 2,174.5 | 233.7 | 203 |
| 2022-03-31 | 2,054.3 | 245.7 | 209.6 |
| 2021-12-31 | 2,278.3 | 12.3 | 223.3 |
| 2021-09-30 | 2,235.5 | 249.8 | 256.5 |
SR's Quality Factors
The “Quality” component of the POWR Ratings focuses on 31 different factors of a companies fundamentals and operational strength. Here are some key insights as we drill into the specifics of these quality attributes.- SR has a Quality Grade of D, ranking ahead of 13.87% of graded US stocks.
- SR's asset turnover comes in at 0.254 -- ranking 36th of 105 Utilities stocks.
- OKE, DTE, and IDA are the stocks whose asset turnover ratios are most correlated with SR.

The table below shows SR's key quality metrics over time.
| Period | Asset Turnover | Gross Margin | ROIC |
|---|---|---|---|
| 2021-06-30 | 0.254 | 0.289 | 0.046 |
| 2021-03-31 | 0.261 | 0.292 | 0.034 |
| 2020-12-31 | 0.221 | 0.326 | 0.027 |
| 2020-09-30 | 0.232 | 0.298 | 0.024 |
| 2020-06-30 | 0.233 | 0.282 | 0.022 |
| 2020-03-31 | 0.237 | 0.265 | 0.037 |
SR Price Target
For more insight on analysts targets of SR, see our SR price target page. And for a list of of all stocks sorted by upside potential based on analyst target price, see our Top Price Target page.
| Average Price Target | $79.10 | Average Broker Recommendation | 1.45 (Moderate Buy) |
Spire Inc. (SR) Company Bio
Spire Inc. engages in the retail distribution, sale, and marketing of natural gas in Missouri and Alabama. The company was founded in 1857 and is based in St. Louis, Missouri.
Latest SR News From Around the Web
Below are the latest news stories about SPIRE INC that investors may wish to consider to help them evaluate SR as an investment opportunity.
Despite lower earnings than five years ago, Spire (NYSE:SR) investors are up 4.8% since thenIn order to justify the effort of selecting individual stocks, it's worth striving to beat the returns from a market... |
Spire Inc's Dividend AnalysisSpire Inc(NYSE:SR) recently announced a dividend of $0.76 per share, payable on 2024-01-03, with the ex-dividend date set for 2023-12-08. As investors look forward to this upcoming payment, the spotlight also shines on the company's dividend history, yield, and growth rates. Using the data from GuruFocus, let's look into Spire Inc's dividend performance and assess its sustainability. |
Spire named one of Newsweek's 'Most Responsible Companies' for fifth year in a rowFor the fifth consecutive year, Spire has again been named one of "America's Most Responsible Companies" by Newsweek, recognizing the company for a strong performance in three areas — environment, social responsibilities and corporate governance. |
Spire's (NYSE:SR) Dividend Will Be Increased To $0.755Spire Inc. ( NYSE:SR ) has announced that it will be increasing its dividend from last year's comparable payment on the... |
Energy Sector Caution: 3 Natural Gas Stocks Not Worth HoldingThe gloomy market outlook is taking a financial toll on energy companies, especially for these three natural gas stocks to sell. |
SR Price Returns
| 1-mo | 1.07% |
| 3-mo | 0.62% |
| 6-mo | 3.43% |
| 1-year | -14.73% |
| 3-year | -0.66% |
| 5-year | -6.96% |
| YTD | -4.68% |
| 2023 | -5.26% |
| 2022 | 9.81% |
| 2021 | 5.86% |
| 2020 | -20.18% |
| 2019 | 15.81% |
SR Dividends
| Ex-Dividend Date | Type | Payout Amount | Change | ||||||
|---|---|---|---|---|---|---|---|---|---|
| Loading, please wait... | |||||||||
Continue Researching SR
Want to do more research on Spire Inc's stock and its price? Try the links below:Spire Inc (SR) Stock Price | Nasdaq
Spire Inc (SR) Stock Quote, History and News - Yahoo Finance
Spire Inc (SR) Stock Price and Basic Information | MarketWatch
Loading social stream, please wait...