
ONE Gas, Inc. (OGS): Price and Financial Metrics
OGS Price/Volume Stats
| Current price | $60.74 | 52-week high | $83.89 |
| Prev. close | $61.38 | 52-week low | $55.50 |
| Day low | $60.64 | Volume | 847,800 |
| Day high | $61.40 | Avg. volume | 460,091 |
| 50-day MA | $61.88 | Dividend yield | 4.28% |
| 200-day MA | $70.18 | Market Cap | 3.37B |
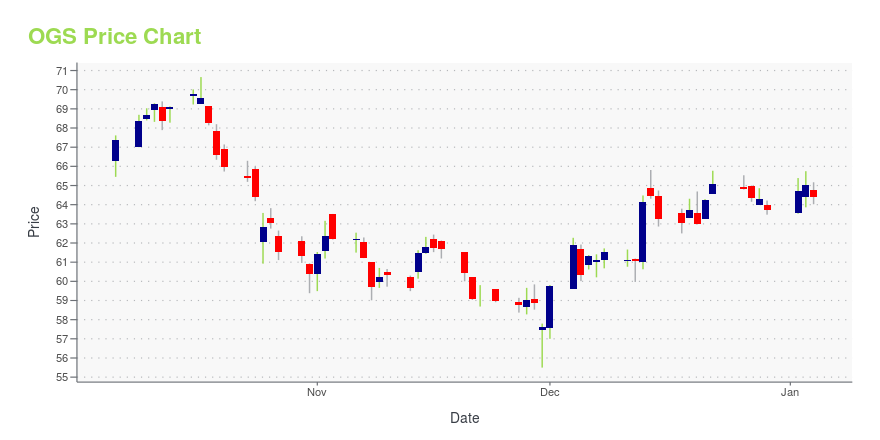
OGS Stock Price Chart Interactive Chart >
OGS POWR Grades
- Value is the dimension where OGS ranks best; there it ranks ahead of 76.44% of US stocks.
- The strongest trend for OGS is in Quality, which has been heading down over the past 26 weeks.
- OGS ranks lowest in Sentiment; there it ranks in the 11th percentile.

OGS Stock Summary
- With a one year PEG ratio of 104.72, ONE GAS INC is expected to have a higher PEG ratio (a measure of how expensive a stock is relative to its expected earnings growth) than 74.42% of US stocks.
- Price to trailing twelve month operating cash flow for OGS is currently 4.2, higher than only 15.86% of US stocks with positive operating cash flow.
- The ratio of debt to operating expenses for ONE GAS INC is higher than it is for about 78.53% of US stocks.
- Stocks with similar financial metrics, market capitalization, and price volatility to ONE GAS INC are AVA, RGCO, UONE, SHO, and WTM.
- Visit OGS's SEC page to see the company's official filings. To visit the company's web site, go to www.onegas.com.
OGS Valuation Summary
- OGS's EV/EBIT ratio is 14.5; this is 25.45% lower than that of the median Utilities stock.
- Over the past 121 months, OGS's price/sales ratio has gone up 0.2.

Below are key valuation metrics over time for OGS.
| Stock | Date | P/S | P/B | P/E | EV/EBIT |
|---|---|---|---|---|---|
| OGS | 2023-12-27 | 1.4 | 1.3 | 15.7 | 14.5 |
| OGS | 2023-12-26 | 1.4 | 1.4 | 15.8 | 14.5 |
| OGS | 2023-12-22 | 1.4 | 1.4 | 15.9 | 14.5 |
| OGS | 2023-12-21 | 1.4 | 1.3 | 15.7 | 14.4 |
| OGS | 2023-12-20 | 1.4 | 1.3 | 15.4 | 14.3 |
| OGS | 2023-12-19 | 1.4 | 1.3 | 15.5 | 14.4 |
OGS Growth Metrics
- The 5 year net income to common stockholders growth rate now stands at 21.71%.
- Its year over year net cashflow from operations growth rate is now at 115.65%.
- The 4 year revenue growth rate now stands at 3.45%.

The table below shows OGS's growth in key financial areas (numbers in millions of US dollars).
| Date | Revenue | Operating Cash Flow | Net Income to Common Stock |
|---|---|---|---|
| 2022-12-31 | 2,578.005 | 1,570.842 | 221.742 |
| 2022-09-30 | 2,353.532 | 1,580.746 | 215.222 |
| 2022-06-30 | 2,268.092 | 328.368 | 211.774 |
| 2022-03-31 | 2,154.763 | 231.244 | 209.792 |
| 2021-12-31 | 1,808.597 | -1,535.657 | 206.434 |
| 2021-09-30 | 1,699.035 | -1,521.406 | 204.252 |
OGS's Quality Factors
The “Quality” component of the POWR Ratings focuses on 31 different factors of a companies fundamentals and operational strength. Here are some key insights as we drill into the specifics of these quality attributes.- OGS has a Quality Grade of D, ranking ahead of 9.84% of graded US stocks.
- OGS's asset turnover comes in at 0.219 -- ranking 48th of 105 Utilities stocks.
- LNT, PPL, and ORA are the stocks whose asset turnover ratios are most correlated with OGS.

The table below shows OGS's key quality metrics over time.
| Period | Asset Turnover | Gross Margin | ROIC |
|---|---|---|---|
| 2021-09-30 | 0.219 | 0.602 | 0.036 |
| 2021-06-30 | 0.233 | 0.607 | 0.040 |
| 2021-03-31 | 0.249 | 0.616 | 0.046 |
| 2020-12-31 | 0.264 | 0.649 | 0.053 |
| 2020-09-30 | 0.263 | 0.653 | 0.054 |
| 2020-06-30 | 0.266 | 0.648 | 0.054 |
OGS Price Target
For more insight on analysts targets of OGS, see our OGS price target page. And for a list of of all stocks sorted by upside potential based on analyst target price, see our Top Price Target page.
| Average Price Target | $79.50 | Average Broker Recommendation | 1.88 (Hold) |
ONE Gas, Inc. (OGS) Company Bio
One Gas Inc. provides natural gas distribution services approximately to customers in Oklahoma, Kansas and Texas. The company was established in 2014 and is based in Tulsa, Oklahoma.
Latest OGS News From Around the Web
Below are the latest news stories about ONE GAS INC that investors may wish to consider to help them evaluate OGS as an investment opportunity.
Here's Why ONE Gas (OGS) is a Strong Growth StockWondering how to pick strong, market-beating stocks for your investment portfolio? Look no further than the Zacks Style Scores. |
Estimating The Intrinsic Value Of ONE Gas, Inc. (NYSE:OGS)Key Insights ONE Gas' estimated fair value is US$66.82 based on Dividend Discount Model ONE Gas' US$61.04 share price... |
ONE Gas to Participate in BofA, Mizuho, and Wells Fargo Utility ConferencesONE Gas, Inc. (NYSE: OGS) today announced it will participate in the BofA Securities Gas Utility Conference virtually on Monday, Dec. 4, 2023, followed by the Mizuho Power, Energy, & Infrastructure Conference in the afternoon, in New York City. On Wednesday, Dec. 6, 2023, the ONE Gas executive management team will attend the Wells Fargo Midstream and Utilities Symposium. |
ONE Gas (OGS) Unveils 2024 and Long-Term Investment PlanONE Gas (OGS) announces its long-term capital investment plan. Systematic investments will further strengthen its infrastructure and allow it to meet customer demand efficiently. |
ONE Gas Issues 2024 Financial GuidanceONE Gas, Inc. (NYSE: OGS) today issued financial guidance for 2024. |
OGS Price Returns
| 1-mo | 2.64% |
| 3-mo | 2.83% |
| 6-mo | -17.91% |
| 1-year | -23.02% |
| 3-year | -10.20% |
| 5-year | -16.73% |
| YTD | -4.68% |
| 2023 | -12.77% |
| 2022 | 0.63% |
| 2021 | 4.36% |
| 2020 | -15.73% |
| 2019 | 20.26% |
OGS Dividends
| Ex-Dividend Date | Type | Payout Amount | Change | ||||||
|---|---|---|---|---|---|---|---|---|---|
| Loading, please wait... | |||||||||
Continue Researching OGS
Here are a few links from around the web to help you further your research on ONE Gas Inc's stock as an investment opportunity:ONE Gas Inc (OGS) Stock Price | Nasdaq
ONE Gas Inc (OGS) Stock Quote, History and News - Yahoo Finance
ONE Gas Inc (OGS) Stock Price and Basic Information | MarketWatch
Loading social stream, please wait...