
MGE Energy Inc. (MGEE): Price and Financial Metrics
MGEE Price/Volume Stats
| Current price | $65.30 | 52-week high | $83.27 |
| Prev. close | $65.73 | 52-week low | $62.09 |
| Day low | $65.15 | Volume | 165,600 |
| Day high | $66.03 | Avg. volume | 165,667 |
| 50-day MA | $69.32 | Dividend yield | 2.62% |
| 200-day MA | $73.52 | Market Cap | 2.36B |
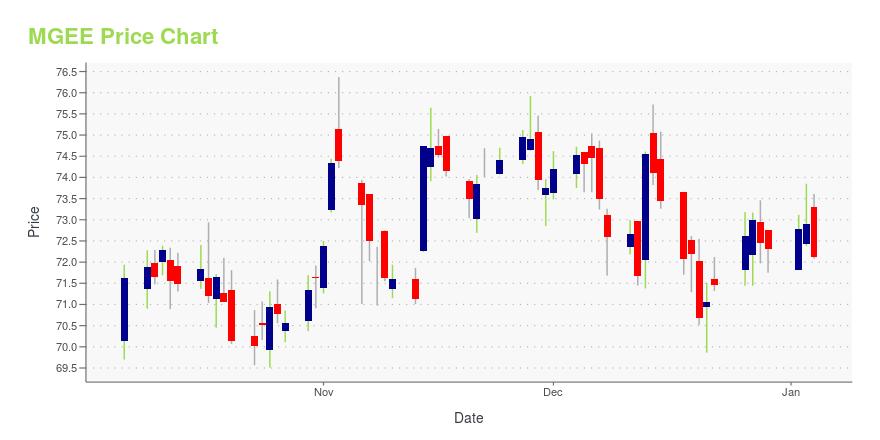
MGEE Stock Price Chart Interactive Chart >
MGEE POWR Grades
- Stability is the dimension where MGEE ranks best; there it ranks ahead of 74.09% of US stocks.
- The strongest trend for MGEE is in Quality, which has been heading up over the past 26 weeks.
- MGEE's current lowest rank is in the Value metric (where it is better than 10.52% of US stocks).

MGEE Stock Summary
- Of note is the ratio of MGE ENERGY INC's sales and general administrative expense to its total operating expenses; only 0.17% of US stocks have a lower such ratio.
- The ratio of debt to operating expenses for MGE ENERGY INC is higher than it is for about 88.43% of US stocks.
- The volatility of MGE ENERGY INC's share price is greater than that of merely 2.88% US stocks with at least 200 days of trading history.
- Stocks that are quantitatively similar to MGEE, based on their financial statements, market capitalization, and price volatility, are UTL, ALE, MDU, AGR, and IDA.
- Visit MGEE's SEC page to see the company's official filings. To visit the company's web site, go to www.mgeenergy.com.
MGEE Valuation Summary
- MGEE's price/earnings ratio is 22.2; this is 14.14% higher than that of the median Utilities stock.
- MGEE's EV/EBIT ratio has moved up 5.4 over the prior 243 months.

Below are key valuation metrics over time for MGEE.
| Stock | Date | P/S | P/B | P/E | EV/EBIT |
|---|---|---|---|---|---|
| MGEE | 2023-12-27 | 3.7 | 2.9 | 22.2 | 19.1 |
| MGEE | 2023-12-26 | 3.7 | 2.9 | 22.1 | 19.0 |
| MGEE | 2023-12-22 | 3.6 | 2.9 | 21.8 | 18.8 |
| MGEE | 2023-12-21 | 3.6 | 2.9 | 21.7 | 18.7 |
| MGEE | 2023-12-20 | 3.6 | 2.8 | 21.5 | 18.7 |
| MGEE | 2023-12-19 | 3.6 | 2.9 | 22.0 | 19.0 |
MGEE Growth Metrics
- Its year over year cash and equivalents growth rate is now at 155.76%.
- Its 3 year price growth rate is now at 19.73%.
- Its 2 year net cashflow from operations growth rate is now at 18.8%.

The table below shows MGEE's growth in key financial areas (numbers in millions of US dollars).
| Date | Revenue | Operating Cash Flow | Net Income to Common Stock |
|---|---|---|---|
| 2022-09-30 | 686.752 | 140.512 | 102.961 |
| 2022-06-30 | 669.225 | 170.27 | 104.158 |
| 2022-03-31 | 647.607 | 155.743 | 105.248 |
| 2021-12-31 | 606.584 | 137.527 | 105.761 |
| 2021-09-30 | 581.027 | 177.729 | 108.497 |
| 2021-06-30 | 570.365 | 165.526 | 105.374 |
MGEE's Quality Factors
The “Quality” component of the POWR Ratings focuses on 31 different factors of a companies fundamentals and operational strength. Here are some key insights as we drill into the specifics of these quality attributes.- MGEE has a Quality Grade of C, ranking ahead of 45.15% of graded US stocks.
- MGEE's asset turnover comes in at 0.267 -- ranking 33rd of 105 Utilities stocks.
- AWK, AQN, and FE are the stocks whose asset turnover ratios are most correlated with MGEE.

The table below shows MGEE's key quality metrics over time.
| Period | Asset Turnover | Gross Margin | ROIC |
|---|---|---|---|
| 2021-09-30 | 0.267 | 0.333 | 0.053 |
| 2021-06-30 | 0.268 | 0.340 | 0.055 |
| 2021-03-31 | 0.267 | 0.345 | 0.056 |
| 2020-12-31 | 0.264 | 0.342 | 0.055 |
| 2020-09-30 | 0.271 | 0.343 | 0.056 |
| 2020-06-30 | 0.277 | 0.342 | 0.056 |
MGEE Price Target
For more insight on analysts targets of MGEE, see our MGEE price target page. And for a list of of all stocks sorted by upside potential based on analyst target price, see our Top Price Target page.
| Average Price Target | $68.50 | Average Broker Recommendation | 2.25 (Moderate Sell) |
MGE Energy Inc. (MGEE) Company Bio
MGE Energy operates as a public utility holding company in Wisconsin. It operates through five segments: Regulated Electric Utility Operations; Regulated Gas Utility Operations; Nonregulated Energy Operations; Transmission Investments; and All Other. The company was founded in 1855 and is based in Madison, Wisconsin.
Latest MGEE News From Around the Web
Below are the latest news stories about MGE ENERGY INC that investors may wish to consider to help them evaluate MGEE as an investment opportunity.
MGE Energy, Inc.'s (NASDAQ:MGEE) one-year returns climbed after last week's 4.3% gain, institutional investors must be happyKey Insights Institutions' substantial holdings in MGE Energy implies that they have significant influence over the... |
MGE Energy Inc (MGEE) Reports Q3 2023 Earnings of $37.9 Million, Up from $33. ...Increased investments and warmer weather drive up residential sales by 5% |
MGE Energy Reports Third-Quarter 2023 EarningsMADISON, Wis., November 02, 2023--MGE Energy Reports Third-Quarter 2023 Earnings |
Here's What To Make Of MGE Energy's (NASDAQ:MGEE) Decelerating Rates Of ReturnTo find a multi-bagger stock, what are the underlying trends we should look for in a business? Firstly, we'd want to... |
MGE Energy's (NASDAQ:MGEE) 5.3% CAGR outpaced the company's earnings growth over the same five-year periodIf you buy and hold a stock for many years, you'd hope to be making a profit. Furthermore, you'd generally like to see... |
MGEE Price Returns
| 1-mo | -5.59% |
| 3-mo | -11.05% |
| 6-mo | -12.86% |
| 1-year | -7.23% |
| 3-year | 5.83% |
| 5-year | 10.42% |
| YTD | -9.69% |
| 2023 | 5.10% |
| 2022 | -12.58% |
| 2021 | 19.90% |
| 2020 | -9.30% |
| 2019 | 34.04% |
MGEE Dividends
| Ex-Dividend Date | Type | Payout Amount | Change | ||||||
|---|---|---|---|---|---|---|---|---|---|
| Loading, please wait... | |||||||||
Continue Researching MGEE
Want to see what other sources are saying about Mge Energy Inc's financials and stock price? Try the links below:Mge Energy Inc (MGEE) Stock Price | Nasdaq
Mge Energy Inc (MGEE) Stock Quote, History and News - Yahoo Finance
Mge Energy Inc (MGEE) Stock Price and Basic Information | MarketWatch
Loading social stream, please wait...