
MEDIFAST INC (MED): Price and Financial Metrics
MED Price/Volume Stats
| Current price | $49.99 | 52-week high | $115.32 |
| Prev. close | $51.46 | 52-week low | $49.89 |
| Day low | $49.89 | Volume | 357,100 |
| Day high | $52.22 | Avg. volume | 296,082 |
| 50-day MA | $61.27 | Dividend yield | N/A |
| 200-day MA | $76.88 | Market Cap | 544.54M |
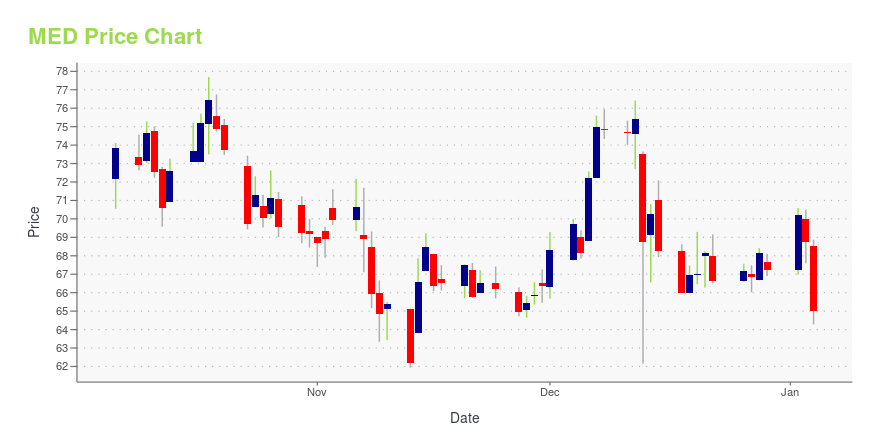
MED Stock Price Chart Interactive Chart >
MED POWR Grades
- MED scores best on the Quality dimension, with a Quality rank ahead of 98.99% of US stocks.
- The strongest trend for MED is in Quality, which has been heading down over the past 26 weeks.
- MED's current lowest rank is in the Sentiment metric (where it is better than 5.01% of US stocks).

MED Stock Summary
- The capital turnover (annual revenue relative to shareholder's equity) for MED is 6.31 -- better than 93.52% of US stocks.
- With a price/earnings ratio of 6.25, MEDIFAST INC P/E ratio is greater than that of about only 7.81% of stocks in our set with positive earnings.
- The ratio of debt to operating expenses for MEDIFAST INC is higher than it is for about just 7.57% of US stocks.
- Stocks with similar financial metrics, market capitalization, and price volatility to MEDIFAST INC are BBW, RYI, IMKTA, GIC, and CAL.
- MED's SEC filings can be seen here. And to visit MEDIFAST INC's official web site, go to medifastinc.com.
MED Valuation Summary
- MED's price/sales ratio is 0.6; this is 70% lower than that of the median Consumer Cyclical stock.
- Over the past 243 months, MED's price/sales ratio has gone down 5.2.

Below are key valuation metrics over time for MED.
| Stock | Date | P/S | P/B | P/E | EV/EBIT |
|---|---|---|---|---|---|
| MED | 2023-12-29 | 0.6 | 3.8 | 6.1 | 4.3 |
| MED | 2023-12-28 | 0.6 | 3.8 | 6.2 | 4.3 |
| MED | 2023-12-27 | 0.6 | 3.8 | 6.1 | 4.2 |
| MED | 2023-12-26 | 0.6 | 3.8 | 6.1 | 4.3 |
| MED | 2023-12-22 | 0.6 | 3.8 | 6.1 | 4.2 |
| MED | 2023-12-21 | 0.6 | 3.8 | 6.2 | 4.3 |
MED Growth Metrics
- The year over year price growth rate now stands at -22.43%.
- Its year over year cash and equivalents growth rate is now at -42.73%.
- The year over year revenue growth rate now stands at 46.12%.
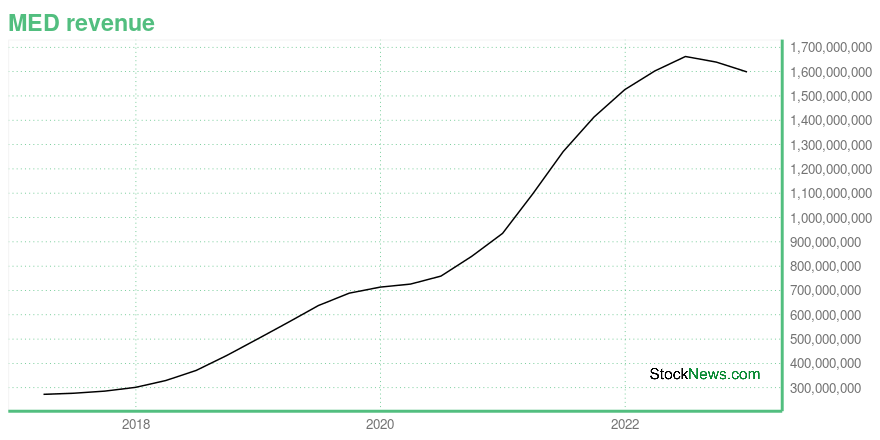
The table below shows MED's growth in key financial areas (numbers in millions of US dollars).
| Date | Revenue | Operating Cash Flow | Net Income to Common Stock |
|---|---|---|---|
| 2022-12-31 | 1,598.577 | 194.57 | 143.568 |
| 2022-09-30 | 1,639.165 | 135.372 | 151.072 |
| 2022-06-30 | 1,662.162 | 95.776 | 156.899 |
| 2022-03-31 | 1,603.018 | 72.892 | 164.749 |
| 2021-12-31 | 1,526.087 | 94.545 | 164.031 |
| 2021-09-30 | 1,413.165 | 121.833 | 158.002 |
MED's Quality Factors
The “Quality” component of the POWR Ratings focuses on 31 different factors of a companies fundamentals and operational strength. Here are some key insights as we drill into the specifics of these quality attributes.- MED has a Quality Grade of A, ranking ahead of 99.43% of graded US stocks.
- MED's asset turnover comes in at 4.143 -- ranking 1st of 59 Food Products stocks.
- TWNK, TOFB, and KHC are the stocks whose asset turnover ratios are most correlated with MED.

The table below shows MED's key quality metrics over time.
| Period | Asset Turnover | Gross Margin | ROIC |
|---|---|---|---|
| 2021-06-30 | 4.143 | 0.744 | 19.148 |
| 2021-03-31 | 4.006 | 0.739 | 72.885 |
| 2020-12-31 | 3.851 | 0.746 | 8.172 |
| 2020-09-30 | 3.779 | 0.746 | 4.378 |
| 2020-06-30 | 3.670 | 0.745 | 2.384 |
| 2020-03-31 | 3.596 | 0.753 | 1.821 |
MED Price Target
For more insight on analysts targets of MED, see our MED price target page. And for a list of of all stocks sorted by upside potential based on analyst target price, see our Top Price Target page.
| Average Price Target | $363.33 | Average Broker Recommendation | 1.33 (Strong Buy) |
MEDIFAST INC (MED) Company Bio
Medifast Inc. is a manufacturer and provider of clinically weight-loss and weight-maintenance products and programs. The company was founded in 1980 and is based in Owings Mills, Maryland.
Latest MED News From Around the Web
Below are the latest news stories about MEDIFAST INC that investors may wish to consider to help them evaluate MED as an investment opportunity.
Medifast's (MED) Holistic Health Solution, Innovation Bode WellMedifast's (MED) focus on combining lifestyle coaching with innovative health solutions and targeting diverse markets bode well amid challenges in customer acquisition and high costs. |
Is Medifast, Inc. (NYSE:MED) Expensive For A Reason? A Look At Its Intrinsic ValueKey Insights Using the 2 Stage Free Cash Flow to Equity, Medifast fair value estimate is US$54.94 Medifast is estimated... |
7 Dividend Stocks I Wouldn’t Touch With a 10-Foot PoleAvoid these seven dividend stocks to sell at all costs, as their payouts may not be a sustainable as they seem. |
Potential 300% Upside: Uncovering Medifast's Investment OpportunityA look at the company's innovative wellness, robust growth and investment upside |
Medifast (MED) Collaborates With LifeMD, Discontinues DividendMedifast (MED) penetrates the medically supported weight loss market via a collaboration with LifeMD, Inc. (LFMD). The company discontinues quarterly cash dividends. |
MED Price Returns
| 1-mo | -6.17% |
| 3-mo | -23.98% |
| 6-mo | -39.54% |
| 1-year | -54.13% |
| 3-year | -78.82% |
| 5-year | -53.63% |
| YTD | -25.63% |
| 2023 | -38.34% |
| 2022 | -42.31% |
| 2021 | 9.36% |
| 2020 | 86.18% |
| 2019 | -9.73% |
Continue Researching MED
Want to do more research on Medifast Inc's stock and its price? Try the links below:Medifast Inc (MED) Stock Price | Nasdaq
Medifast Inc (MED) Stock Quote, History and News - Yahoo Finance
Medifast Inc (MED) Stock Price and Basic Information | MarketWatch
Loading social stream, please wait...