
SEMrush Holdings, Inc. (SEMR): Price and Financial Metrics
SEMR Price/Volume Stats
| Current price | $12.65 | 52-week high | $14.09 |
| Prev. close | $12.32 | 52-week low | $7.21 |
| Day low | $12.03 | Volume | 395,700 |
| Day high | $12.68 | Avg. volume | 468,961 |
| 50-day MA | $12.24 | Dividend yield | N/A |
| 200-day MA | $9.76 | Market Cap | 1.81B |
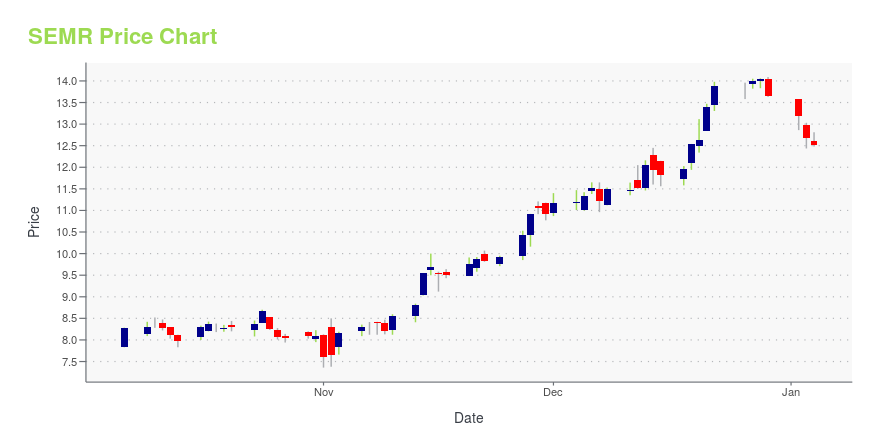
SEMR Stock Price Chart Interactive Chart >
SEMR POWR Grades
- SEMR scores best on the Sentiment dimension, with a Sentiment rank ahead of 91.79% of US stocks.
- The strongest trend for SEMR is in Quality, which has been heading up over the past 26 weeks.
- SEMR ranks lowest in Value; there it ranks in the 31st percentile.

SEMR Stock Summary
- With a one year PEG ratio of 425.87, SEMRUSH HOLDINGS INC is expected to have a higher PEG ratio (a measure of how expensive a stock is relative to its expected earnings growth) than 92.24% of US stocks.
- SEMRUSH HOLDINGS INC's stock had its IPO on March 25, 2021, making it an older stock than just 8.27% of US equities in our set.
- The ratio of debt to operating expenses for SEMRUSH HOLDINGS INC is higher than it is for about just 9.14% of US stocks.
- Stocks that are quantitatively similar to SEMR, based on their financial statements, market capitalization, and price volatility, are CVV, BIO, HBIO, LUNA, and TRIP.
- To dig deeper into the stock's financial statements, go to SEMR's page on browse-edgar?action=getcompany&CIK=0001831840.
SEMR Valuation Summary
- In comparison to the median Technology stock, SEMR's price/sales ratio is 107.41% higher, now standing at 5.6.
- SEMR's price/earnings ratio has moved up 140.8 over the prior 33 months.

Below are key valuation metrics over time for SEMR.
| Stock | Date | P/S | P/B | P/E | EV/EBIT |
|---|---|---|---|---|---|
| SEMR | 2023-12-08 | 5.6 | 8.0 | -83.1 | -90.9 |
| SEMR | 2023-12-07 | 5.5 | 7.8 | -81.0 | -88.6 |
| SEMR | 2023-12-06 | 5.6 | 8.1 | -83.2 | -91.1 |
| SEMR | 2023-12-05 | 5.5 | 7.9 | -81.9 | -89.6 |
| SEMR | 2023-12-04 | 5.5 | 7.8 | -80.8 | -88.4 |
| SEMR | 2023-12-01 | 5.5 | 7.8 | -80.7 | -88.3 |
SEMrush Holdings, Inc. (SEMR) Company Bio
SEMrush Holdings, Inc. develops online visibility management software as a service (SaaS) platform. It helps businesses to run search engine optimization, pay-per-click, content, social media, and competitive research campaigns. The company offers insights and solutions to build, manage, and measure campaigns across various marketing channels. SEMrush Holdings, Inc. was founded in 2008 and is based in Boston, Massachusetts with additional offices in Pennsylvania, Texas, Czech Republic, Cyprus, Poland, and Russia.
Latest SEMR News From Around the Web
Below are the latest news stories about SEMRUSH HOLDINGS INC that investors may wish to consider to help them evaluate SEMR as an investment opportunity.
UserWay and Semrush Supercharge Digital Marketing with Accessibility ToolsUserWay (TASE: UWAY), a full-service provider of digital accessibility technologies, announced a collaboration with Semrush (NYSE: SEMR) the leading online visibility management SaaS platform. UserWay's web accessibility compliance technology is now available on the Semrush App Center, including the UserWay Accessibility Scanner and the UserWay Accessibility Widget. |
Are You Looking for a Top Momentum Pick? Why SEMrush Holdings, Inc. (SEMR) is a Great ChoiceDoes SEMrush Holdings, Inc. (SEMR) have what it takes to be a top stock pick for momentum investors? Let's find out. |
Yext (YEXT) Reports Q3: Everything You Need To Know Ahead Of EarningsOnline reputation and search platform Yext (NYSE:YEXT) will be reporting earnings tomorrow after the bell. Here's what to look for. |
Insider Sell Alert: President Eugenie Levin Sells 39,076 Shares of SEMrush Holdings Inc (SEMR)In a notable insider transaction, President Eugenie Levin sold 39,076 shares of SEMrush Holdings Inc (NYSE:SEMR) on December 1, 2023. |
Why SEMrush Holdings, Inc. (SEMR) Might be Well Poised for a SurgeSEMrush Holdings, Inc. (SEMR) shares have started gaining and might continue moving higher in the near term, as indicated by solid earnings estimate revisions. |
SEMR Price Returns
| 1-mo | 7.84% |
| 3-mo | 28.04% |
| 6-mo | 39.01% |
| 1-year | 39.93% |
| 3-year | N/A |
| 5-year | N/A |
| YTD | -7.39% |
| 2023 | 67.81% |
| 2022 | -60.96% |
| 2021 | N/A |
| 2020 | N/A |
| 2019 | N/A |
Loading social stream, please wait...