
Shionogi & Co., Ltd. (SGIOY): Price and Financial Metrics
SGIOY Price/Volume Stats
| Current price | $11.84 | 52-week high | $12.84 |
| Prev. close | $11.66 | 52-week low | $10.10 |
| Day low | $11.81 | Volume | 49,100 |
| Day high | $11.90 | Avg. volume | 93,806 |
| 50-day MA | $12.07 | Dividend yield | 1.45% |
| 200-day MA | $11.33 | Market Cap | 14.56B |
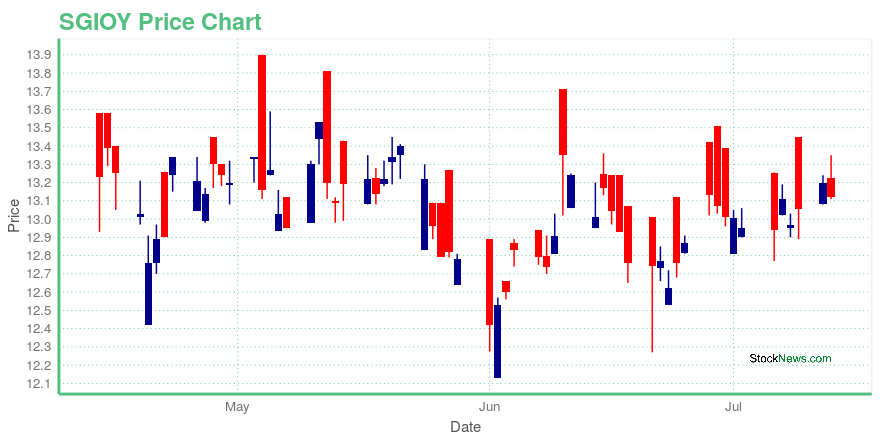
SGIOY Stock Price Chart Interactive Chart >
Shionogi & Co., Ltd. (SGIOY) Company Bio
Shionogi & Co., Ltd. is a pharmaceutical company. The Company develops prescription and over-the-counter drugs and diagnostics.
SGIOY Price Returns
| 1-mo | -3.78% |
| 3-mo | 1.49% |
| 6-mo | 9.88% |
| 1-year | 4.40% |
| 3-year | -14.30% |
| 5-year | N/A |
| YTD | -1.10% |
| 2023 | -2.54% |
| 2022 | -29.45% |
| 2021 | 29.62% |
| 2020 | -11.90% |
| 2019 | N/A |
SGIOY Dividends
| Ex-Dividend Date | Type | Payout Amount | Change | ||||||
|---|---|---|---|---|---|---|---|---|---|
| Loading, please wait... | |||||||||
Loading social stream, please wait...